Everyone has a theory about what makes a Reel go viral. We decided to look at the numbers instead.
Between March and July 2026, Viral Manager detected 3,717 viral Reels across the Instagram accounts tracked by our client agencies in the creator niche. Of those, 439 went through our full Computer Vision analysis: hook type, pacing, energy level, emotional tone, setting, visual keywords. Here's what the data actually says, without storytelling or guesswork.
The method, in the open
A post isn't "viral" because it racked up a lot of views in absolute terms. A Reel at 200,000 views is a hit on a 10,000-follower account and a flop on a million-follower one. That's why we work in relative score: the multiple of an account's usual performance. A score of 4 = 4x that specific account's baseline.
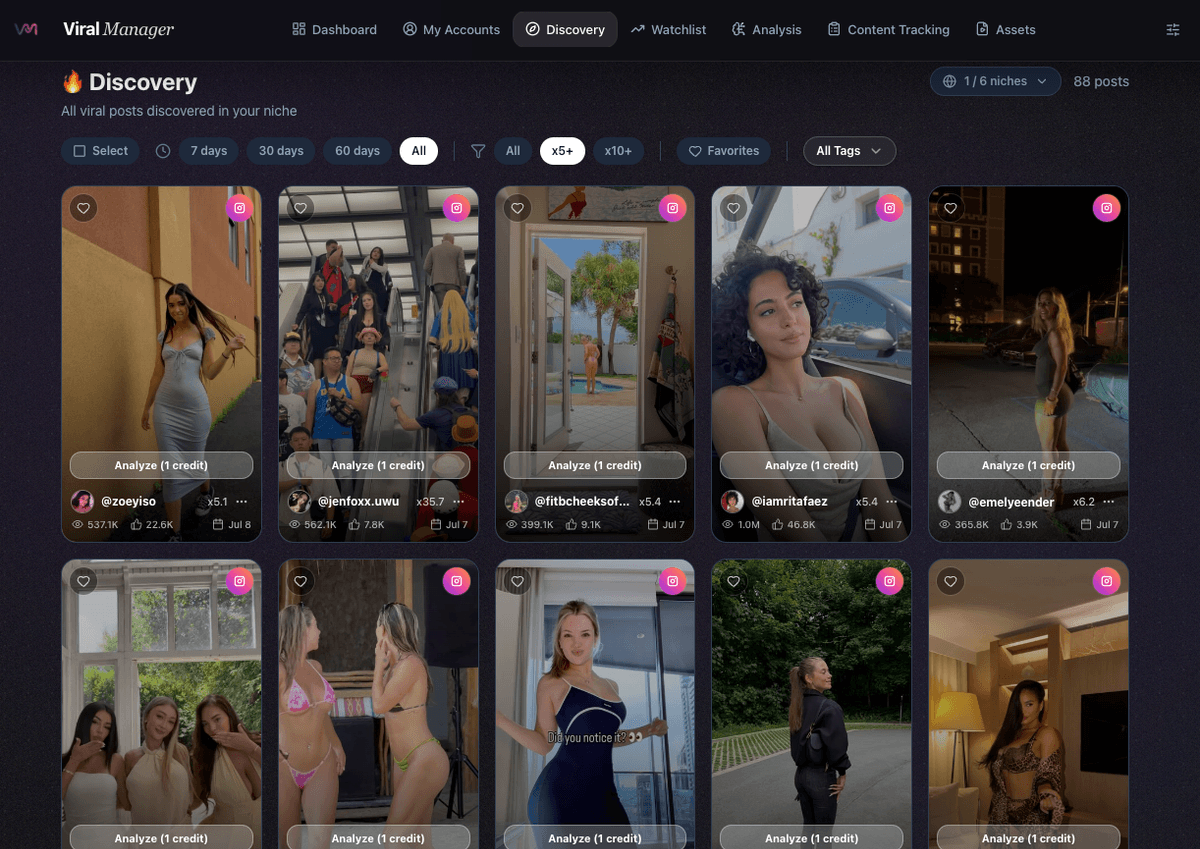
Detection runs on each account's own P60 threshold, refreshed every 6 hours. No resold third-party data: only the accounts each agency chooses to track.
The spring ramp-up
The volume of detected viral Reels climbed through spring as our agencies expanded their Watchlists:
| Month | Viral Reels detected | Median relative score | Median views |
|---|---|---|---|
| March | 5 | — (sample too small) | 460,000 |
| April | 36 | 3.3x | 280,000 |
| May | 818 | 4.07x | 259,000 |
| June | 2,280 | 3.8x | 296,000 |
| July (partial) | 578 | 2.82x | 237,000 |
May was the peak of "viral quality" (highest median score), June the peak of volume. Across the whole period, a median of 5,034 likes per detected Reel.
How viral is viral? The score distribution
This is where the data gets useful for a manager. Across the 3,295 Reels with a usable score:
| Relative score | Share of viral Reels |
|---|---|
| 10x and above | 15% (500 Reels) |
| 5x to 10x | 21% |
| 3x to 5x | 26% |
| 2x to 3x | 34% |
| Below 2x | 4% |
💡 500 Reels crossed 10x their account's baseline. These are the posts to dissect and replicate first: they aren't accidents, they share precise patterns, the ones we break down below.
In other words: more than 1 in 3 viral Reels hit at least 5x normal account performance. Content that "really takes off" isn't that rare when you know which accounts to watch.
The winning hook: the everyday scenario
Across the 439 analyzed Reels, one hook type dominates all others: the Relatable Scenario — a mundane, everyday situation the viewer recognizes instantly.
| Hook type | Frequency (primary hook) |
|---|---|
| Relatable Scenario | ~21% (most common, ~30% counting blends) |
| Curiosity / Teaser | The second most-used lever |
| Question Hook | Third |
| Visually Striking | Fourth |
The winning pattern isn't spectacular performance or an unexpected twist. It's "that's exactly me." An overlay text like "When you're losing the argument…" over a mundane scene beats sophisticated editing, over and over.
Related reading
Stop scrolling. Start scaling.
Viral Manager monitors Instagram & TikTok virality every 6h, auto-generates content blueprints, and assigns tasks to your creators — all in one platform.
The counterpoint: slow, calm, intimate
Here's the data point that runs against most of the TikTok advice you hear: creator viral Reels are neither fast nor high-energy.
- Only 7% of viral Reels were fast-paced. 93% were slow or medium.
- 92% showed low or medium energy. "High" energy accounts for just 8% of virals.
The myth of the tightly-cut fast edit collapses against the numbers. In this niche, virality comes from intimacy and relatability, not adrenaline. A calm shot, a close-up face, natural light: that's what holds attention.
Tone tells the same story. The most frequent emotions in viral Reels:
confident · humorous · curious · everyday · calm · intimate · relatable
And the setting, read by Computer Vision, sketches a coherent world: woman, overlay-text, bedroom, indoor, natural-light, kitchen, face-close-up, lifestyle, relationship, POV. Content filmed at home, in natural light, with on-screen text. No studio.
The May → June shift: from "everyday" to "confident"
Comparing the two high-volume months, you can see the content move:
- May was the peak of calm: slow pacing peaked, the dominant tone was "everyday," and the setting revolved around overlay-text, natural light and daytime shots. Static, soft, everyday content.
- June shifted toward relational dynamics: pacing moved to medium, the "confident" tone rose to #1, and new keywords emerged — relationship, POV, couple, fashion. Content became bolder, more focused on staging the duo and lifestyle.
💡 What worked in May (calm everyday scenes) still holds, but June shows that adding a relational, self-assured dimension (POV, couple, confident tone) captures a new wave. A good July brief blends both.
What actually overperforms (beyond what's merely frequent)
So far we looked at what's frequent among viral Reels. But frequent doesn't mean high-performing. To settle it, we measured each attribute's lift: its prevalence among the top 25% of performers divided by its prevalence overall. A lift above 1 is a driver; below 1, a brake. This is where the data gets counterintuitive.
And you have to separate two goals that do not pull in the same direction:
- reach (views) — what makes the Reel travel;
- engagement (likes + comments relative to views) — the signal that, for an agency, comes closest to conversion toward the OnlyFans page.
Across the 430 analyzed spring Reels:
| Attribute | Effect on reach | Effect on engagement |
|---|---|---|
| "Everyday" content | ×1.35 (strong view driver) | ×0.36 (severe brake) |
| Kitchen (setting) | ×1.49 | ×0.50 |
| Three-quarter / from-behind framing | ×1.85 / ×1.71 | ×0.57 |
| "Confident" tone | ×0.71 (brake) | ×1.39 (driver) |
| "Bold claim" hook | — | ×1.46 |
| Cinematic / night mood | — | ×1.49 / ×1.38 |
| Extreme close-up | — | ×1.63 |
💡 The reach-bait trap. The relatable "everyday" content that dominates by frequency is a view driver but an engagement brake. It travels far and converts little. If your agency's goal is to turn audience into subscribers (i.e. generate saves, comments, DMs), that's not where to double down.
What actually makes people react (engagement) follows a completely different profile: a confident tone, a bold-claim hook, a cinematic or night mood, tight close-ups, an emotional register ("serious," "melancholic," "romantic" tones overperform sharply). Conversely, "casual," "intriguing" and plain "visually striking" are brakes on both sides.
Put simply: relatability gets you seen, emotion and confidence get you followed. A roster chasing conversion has to balance both, not pile up "everyday" content just because it racks up views.
Method note: lift is correlation, not causation. Views are biased by an account's audience size; engagement rate partially corrects that bias. Minimum support applied per attribute (n ≥ 25).
What an agency manager should take away
- Stop chasing fast edits. The niche rewards calm and intimacy, and the data proves it.
- Separate your goals. The "relatable" hook and "everyday" content drive views; confidence, emotion and night settings drive engagement. Pick your lever based on whether you want reach or conversion.
- Don't confuse frequent with high-performing. "Everyday" dominates by frequency but brakes engagement (×0.36): it's reach-bait, not a conversion driver.
- Watch your niche's accounts, not global trends. The relative score proves virality is audience-specific.
- Dissect the 5x+ posts. 36% of virals get there: there's enough material to build solid blueprints every week.
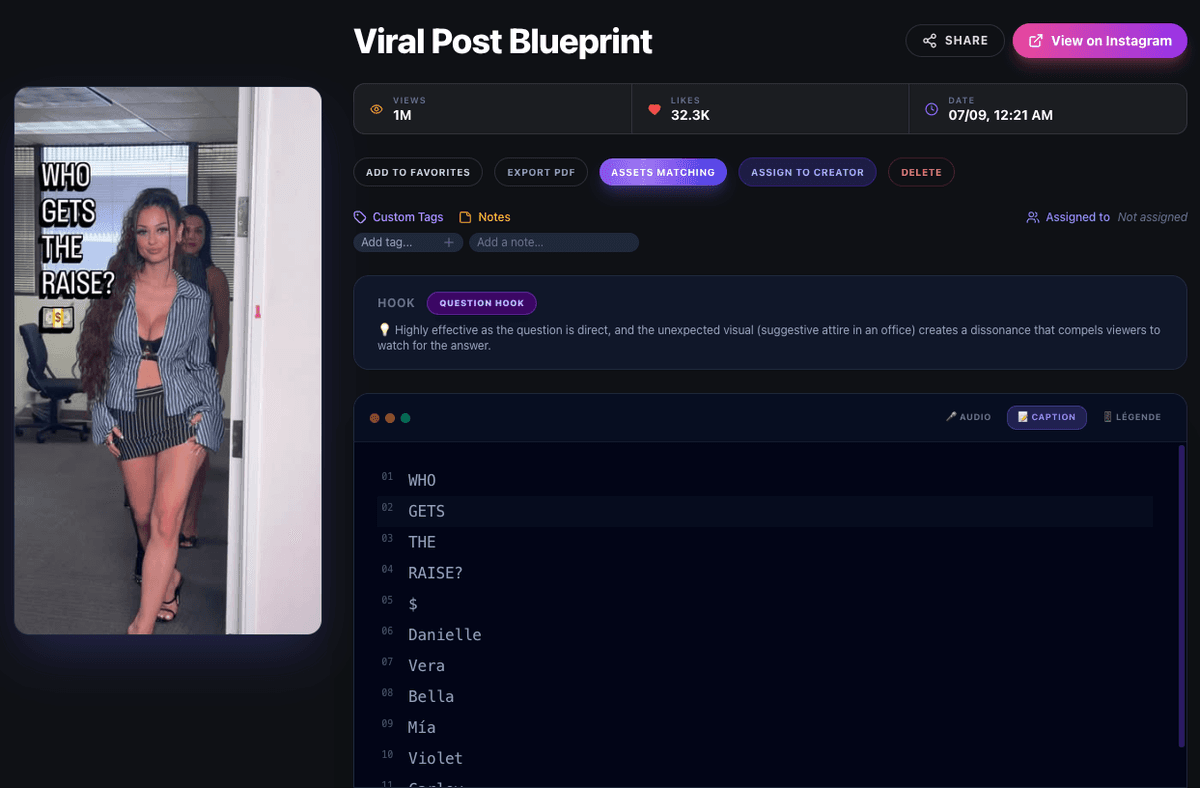
Those five reflexes are exactly the workflow Viral Manager automates: detect the Reels crossing each account's baseline, extract the hook and pattern with Computer Vision, and turn that into a brief ready for your creator. The data in this report isn't a one-off study: it's what the platform produces continuously, every day, for every agency.
Detailed monthly reports: May 2026 viral Reels · June 2026 viral Reels.
Related reading
Resources to go further
Your agency deserves better than spreadsheets.
Join OFM agencies using Viral Manager to spot viral formats before competitors, brief VAs in 5 minutes, and post across creator accounts without shadowban risk.
Starter · Scale · Empire — 7 days free, cancel anytime.
Frequently asked questions
How many viral Reels were analyzed in this report?+
Viral Manager detected 3,717 viral Reels between March and July 2026 across the Instagram accounts tracked by our client agencies. Of those, 439 received a full Computer Vision analysis covering hook, pacing, tone, and visual keywords.
What is the relative score used in the analysis?+
The relative score is the multiple of each account's own baseline: a score of 4 means the post performed 4x better than that specific account's usual output. It's more honest than raw view counts, because 200,000 views can be viral on a 10,000-follower account and unremarkable on a million-follower one.
What type of hook works best for creator Reels?+
The 'Relatable Scenario' hook (an everyday situation the viewer identifies with) dominates by far. It is the primary hook type in roughly 1 in 5 analyzed viral Reels, and present in nearly 30% of cases when counting blended hooks. Curiosity/Teaser and Question hooks follow.
Are viral Reels fast and tightly edited?+
No, and this is the sharpest counterpoint in our data: only 7% of analyzed viral Reels were fast-paced. 93% were slow or medium-paced, and 92% showed low or medium energy. Creator virality comes from intimacy and relatability, not frantic editing.
How does Viral Manager collect this data?+
Viral Manager monitors the Instagram and TikTok accounts each agency adds to its Watchlist every 6 hours, detects posts crossing each account's own P60 threshold, then analyzes them with Computer Vision. Data comes from a proprietary pipeline over the accounts the agency chooses, not resold third-party data.
Viral Manager Team
2026-07-09 · 7 min read